Volume Measurements
Image-Pro with 3D Module only
The Volume Measurements group (found on the 3D Measure ribbon) allows you to select the measurement data you want to collect for the objects identified by the 3D Measure > Count tool. For example, you can obtain an array of 3D measurements, such as volume, sphericity, density, and so on. The tools in this group also allow you to define filters based on volumetric thresholds ("ranges") that you can use to filter out noise and ancillary features. For example, if your objects of interest can be distinguished from noise by some measurement data, then you can set a range for that data item so that Image-Pro selects only objects that fall within that range. Measurement data is returned and display in the Image-Pro Data Table.
The Volume measurement tools are described below.
Types: Click on the Types tool to display the Measurements dialog box. This dialog box shows a sortable list of measurements available for selection in the left-most panel (titled "Available Measurements"). Measurements can be selected by adding them to the list in the right-most panel (titled "Selected Measurements").
Use the two pull-down list boxes at the top of the Available Measurements panel to filter the list of available measurements. The left-most pull-down list box allows you to filter the available measurements list to show only those measurements applicable to a certain kind of feature. Not all measurements are applicable for all features. In the left-most pull-down list box, select the type of feature that you want to select measurements for. If you want to see all measurements, select "All Types."
The right-most pull-down list box allows you to filter the available measurements list to show only those measurements belonging to a selected category. For example, you can limit the list to only those measurements related to Density analysis, Luminance analysis, or Size analysis. If you want to see all measurements, select "All Categories."
A description of each measurement can be accessed using the Image-Pro tooltips feature. Simply position your mouse over the name of the measurement in the Available Measurements panel, and view the tooltip for that measurement. A description of commonly used volume measurements is listed below.
Note that the Minimum and Maximum columns in the right-side panel can be used to define a range of values for the associated measurement type. These fields are a shortcut to the Minimum and Maximum fields of the Edit Measurement Range dialog box. The range defined here, as on Edit Measurement Range dialog box, can be used to filter your threshold segmentation results. These fields are only available if the Filter checkbox for the corresponding measurement type is checked in the Selected Measurements/Filters Panel.
Edit Range: Click on this tool to display the Edit Measurement Range dialog box. You can use the Edit Measurement Range dialog box to filter your threshold segmentation results by limiting the set of found objects to only those objects that meet some measurement criteria. Click here to learn more.
Ranges: Select this option to turn on or off the measurement filter feature. See Edit Range above for more information about filtering your threshold segmentation results using measurement data ranges.
3D Options: Click this tool to display the 3D Options dialog box. The options in the 3D Options dialog box allow you to change various display parameters of the 3D measurement overlays and labels as well as set some options controlling the segmentation of volumes. Click here for more information about the controls on this dialog.
Commonly Used Volume Measurements
- Volume: Measures the volume of an object.
- Surface Area: Measures the surface area of an object.
- Width: Measures the width of the bounding box around an object, in the X direction.
- Height: Measures the height of the bounding box around an object, in the Y direction.
- Depth: Measures the depth of the bounding box around an object, in the Z direction.
- Center X: Indicates the X coordinate of the center of an object.
- Center Y: Indicates the Y coordinate of the center of an object.
- Center Z: Indicates the Z coordinate of the center of an object.
- Center of Mass X: Indicates the X coordinate of the center of mass of an object.
- Center of Mass Y: Indicates the Y coordinate of the center of mass of the object.
- Center of Mass Z: Indicates the Z coordinate of the center of mass of the object.
- Box Volume: Reports the volume of an object's bounding box: ( V = W * H * D ).
- Box Ratio: Reports the ratio between the maximum and minimum sizes of the bounding box: R = Max / Min.
- Volume Fraction: Reports the ratio of an object's volume to the box volume: R = Vobj / Vbox.
- Diameter: Indicates the equivalent diameter of an object.
- Sphericity: Indicates the sphericity of an object, calculated as 6 volumes of an object divided by the equivalent diameter and surface area of object. For perfectly spherical objects, this parameter equals 1; for all other shapes it is less than 1.
- Density (Mean): Indicates the mean density of an object.
- Density (Min): Indicates the minimum density of an object.
- Density (Max): Indicates the maximum density of an object.
- IOD: Measures the Integrated Optical Density of an object.
- Density (st.dev.): Reports the standard deviation of the optical density of an object.
- Radius (max): Indicates the maximum distance between an object's centroid and surface.
- Radius (min): Indicates the minimum distance between an object's centroid and surface.
- Radius Ratio: Displays the ratio between the minimum and maximum radii.
- Hole Count: Number of 3D Holes in the object (measurement available only for direct segmentation).
- Hole Volume: Total volume of 3D holes in the object (measurement available only for direct segmentation).
- Hole Volume Ratio: Ratio between total volumes of holes and volume of the object (measurement available only for direct segmentation).
- Class: Reports the class to which an object belongs. The classification can be done using the Histogram window.
- Feret (max): Indicates the maximum distance between two parallel planes enclosing an object.
- Feret (min): Indicates the minimum distance between two parallel planes enclosing an object.
- Feret Ratio: Indicates the ratio between Feret (max) and Feret (min).
- Alpha Angle: Indicates the angle between the Reference vector (Ref) and the surface Norma (N), in degrees. See Orientation Options below for more information. Note, that angle measurements Alpha, Gamma, Theta and Surface Deviation are available only for iso-surface based volume objects.
- Gamma Angle: Indicates the angle between the Direction vector (Dir) and the projection of the Normal (Proj) to the plane created by the Direction vector (Dir) and the vector (Perp) perpendicular to the Ref-Dir plane. The angle can range from -180 to 180 degrees. The Reference, Direction, and Normal caluclation method are defined through th Orientation Options dialog (see Orientation Options below).
- Theta Angle: Indicates the angle between the Reference vector (Ref) and the projection of the Normal (Proj2) to the plane perpendicular to the Direction vector (Dir). The angle can range from -180 to 180 degrees. The Reference, Direction, and Normal caluclation method are defined through th Orientation Options dialog (see Orientation Options below).
- Surface Deviation: Calculated as the deviation of the end-points of triangular normals. The calculations are done as follows: all triangular normal vectors of the surface are normalized (length set to 1) and the average distance from the mean positions of the end-points to all other vectors is calculated. A uniform surface will have a deviation of 0. The maximum deviation of 1.336 will have a sphere.
- Angle X: Indicates the angle between longest object line (max feret) and the X axis, in degrees. The longest object line vectors can be visualized using the Show longest object line vectors option on the Orientation Options dialog (see Orientation Options below).
- Angle Y: Indicates the angle between longest object line (max feret) and the Y axis, in degrees. The longest object line vectors can be visualized using the Show longest object line vectors option on the Orientation Options dialog (see Orientation Options below).
- Angle Z: Indicates the angle between longest object line (max feret) and the Z axis, in degrees. The longest object line vectors can be visualized using the Show longest object line vectors option on the Orientation Options dialog (see Orientation Options below).
Orientation Options
Orientation measurement options can be set by clicking the Options button on the Measurements dialog box. Orientation in 3D space can be defined using at least 2 angles from perpendicular vectors. These angles are called Alpha and Gamma. Alpha is measured relatively to the Reference vector and Gamma relatively to the Direction vector.
Reference Vector: The Reference vector is defined by the X,Y and Z values entered in the Reference Vector spin boxes. The default vector of 0,0,1 is parallel to the Z axis. The alpha angle is calculated between the specified reference vector and the surface normal.
Direction Vector: The Direction vector is defined by the X,Y and Z values entered in the Direction Vector spin boxes. The default vector of 0,1,0 is parallel to the Y axis. The gamma angle is calculated between the specified direction vector and the projection of the normal to the plane of the direction vector.
Maximum angle between triangle normal and reference vector: This spin box defines which areas (triangles) of the object surface will be taken into account when calculating surface normal. Every surface consists of triangles; every triangle has its own normal vector. If the angle between triangle’s normal and the reference vector exceeds the maximum angle range, the triangle is excluded from the surface normal calculation. The default value is 80 degrees, which excludes triangles on the sides of the object (angles around 90 degrees) and triangles on the opposite side of the object (angles greater than 90 degrees). The maximum value for this parameter is 180.
Surface Normal calculation method: There are two methods provided to calculate the normal vector of surface:
- Average vector, which is calculated as area weighted average normal vector of all surface triangles (within angle range). This method is relatively fast in calculation, but sensitive to deviations on the surface orientation. Small bumps and pits on the surface can slightly affect the vector.
- Median vector, where median vector from all triangles are selected as surface normal. Median vector is the vector that has the minimum sum of distances to all other vectors. This methods provides very stable results; as small bumps and pits on the surface do not affect the result. The vector represents the normal direction of the surface which covers most of the object. This method is very computation intensive, and can be much slower than the Average method for large objects (if each object contains more than 10000 triangles).
Show surface normal vectors: The Show Surface Normal vectors option hides or shows the surface normals on the image.
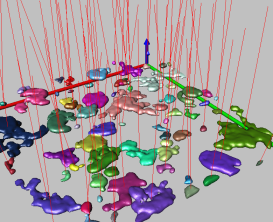
Show longest object line vectors: The Show longest object line vectors option hides or shows the longest object lines that are used to measure Angle X,Y and Z. An example appears here:
See also: