Edit Measurement Range
The Edit Measurement Range window allows you to view the distribution of segmented objects i.e., objects found by Image-Pro using the Count/Size view.
You can set valid ranges for any of your selected Measurement Types, anything outside of this range will be ignored. This is a valuable method for excluding objects that are of no interest such as small pieces of debris or camera noise.
You can view the distribution of your objects either as a Histogram, or a Scatterplot.
Editing Measurement Range using the Histogram
Either with a thresholding tool open and active, or with measurements on your active image, select Edit Range from the Count/Size ribbon. Select the Histogram button from the top of the dialog that opens.
You can set an active range for any of your selected measurement types by selecting from the Types drop-down menu at the top of the dialog.
Area is frequently used to set a valid range, as it’s often helpful to be able to exclude small items of debris and noise, as well as large conglomerates of objects. With Area selected the histogram shows a distribution of Area measurements divided into the selected number of bins.
Ensure that the Active checkbox is selected, then drag the positions of both the Min and Max values on the histogram. As you do so, the valid object overlay updates on the active image.
Alternatively, you can directly enter values in the Min and Max fields beneath the histogram.
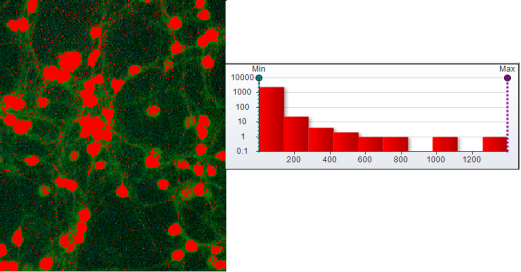
Before moving the marker...
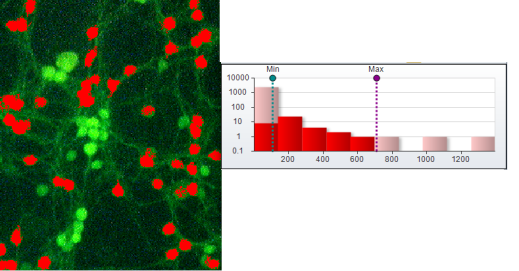
After moving the markers...
The Controls of the Edit Measurement Range Histogram
Bins: The data set grouping is determined by the number of Bins you define. For example, if the range of values for the selected data set is from 0 to 100 and you select "10" in the Bins field, the data will be grouped into 10 bins: Bin #1 contains objects with values falling between 0 and 10, Bin #2 contains objects with values falling between 10 and 20, and so on.
Export Chart: Select an option from the drop-down menu to export the chart as a bitmap to the selected location. You can choose between the current chart size or a custom size.
Log X and Log Y: These controls toggle the X and Y axes of the histogram display between expressing the measurement scale in terms of integers and logarithms of integers. The latter provides a 'stretching' effect.
Active: Enables/disables the filter feature of the Data Histogram dialog box. This checkbox must be selected to apply filters to the Count/Size data set.
Reset: Resets the Min and Max fields to their default values.
Min/Max: These spin boxes allow you to filter objects found in the image based on a specified range of values. Only objects with values that fall between the Min and Max values will be included in the count.
Note: After a Min or Max value is defined, it will only be applied to the image when you click the Apply Filter button (described below).
Apply Filter: Applies the filter defined by the Min and Max spin boxes (described above) to the image. Only objects with values that fall between the Min and Max values will be included in the count.
Apply on Close: Select this option if you prefer to not have to click the Apply Filter button every time you open the Edit Measurement Range dialog box and make some adjustment. If the Apply on Close option is selected, then the changes you make will automatically be applied to the image when you click OK.
Editing Measurement Range using the Scatterplot
Either with a thresholding tool open and active, or with measurements on your active image, select Edit Range from the Count/Size ribbon. Select the Scatterplot button from the top of the dialog that opens.
You can set active ranges for two of your selected measurement types by selecting from the X: and Y: Types drop-down menus at the top of the dialog.
A scatterplot is generated based on the distribution of the types selected for the X and Y axes.
Ensure that the Active checkbox is selected for both axes, then drag the positions of both the Min and Max values on both axes of the scatterplot to set ranges for two measurement types simultaneously. Any objects that are not in the valid range for either of the selected types will not be measured. As you change the Min and Max values, the valid object overlay updates on the active image.
Alternatively, you can directly enter values in the Min and Max fields for both the X and Y axes beneath the scatterplot.
The Controls of the Edit Measurement Range Scatterplot
Export Chart: Select an option from the drop-down menu to export the chart as a bitmap to the selected location. You can choose between the current chart size or a custom size.
Log X and Log Y: These controls toggle the X and Y axes of the scatterplot display between expressing the measurement scale in terms of integers and logarithms of integers. The latter provides a 'stretching' effect.
Active: Enables/disables the filter feature for the selected axis of the scatterplot. At least one of these checkboxes must be selected to apply filters to the Count/Size data set.
Reset: Resets the Min and Max fields of the selected axis to its default values.
Min/Max: These spin boxes allow you to filter objects found in the image based on a specified range of values for the selected axis. Only objects with values that fall between the Min and Max values will be included in the count.
Note: After a Min or Max value is defined, it will only be applied to the image when you click the Apply Filter button (described below).
Apply Filter: Applies the filters defined by the Min and Max spin boxes for each axis of the scatterplot (described above) to the image. Only objects with values that fall between the Min and Max values for both axes will be included in the count.
Apply on Close: Select this option if you prefer to not have to click the Apply Filter button every time you open the Edit Measurement Range dialog box and make adjustments. If the Apply on Close option is selected, then the changes you make will automatically be applied to the image when you click OK.