Line Profile Window
The Line Profile window is displayed when you click on the Line Profile tool on the Measure ribbon. When you click on this tool, the Line Profile window appears at the bottom of the Image-Pro application window.
The Line Profile Window Toolbar
There are some tools at the top of the Line Profile Window that allow you to load and save profiles and export profile data.
Open State: Click this tool to load a previously saved line profile configuration. When you click this tool, you will be prompted to select the *.lps file containing the line profile configuration you want to restore. All line profile attributes, settings, and definitions will be restored, including profile overlays, edge detection parameters and classes, measurements, and options.
Note: The current state of line profile options and definitions will be deleted and replaced with the state loaded from the file.
Save State: Click
this tool to save the current line profile configuration to a file. All
line profile attributes, settings, and definitions will be stored, including
profile overlays, edge detection parameters and classes, measurements,
and options.
Export: Click the down-arrow to see the options for exporting the current data of the line profile window. You can export to a new Microsoft Excel file, Microsoft Word file, or a file of a different type that accepts text data (such as Microsoft Powerpoint), or you can use the "Append to File" option to export to an existing Excel, Word, or other file without overwriting the existing data in that file. Click the "Options" command to show the "Export" page of the Image-ProOptions dialog box. Click here for a description of the various export options.
Show/Hide Statistics: This tool is only enabled when the Line Profile window is in the Measurements view mode (when  is selected in the lower left corner of the Line Profile window). You can use the Show/Hide Statistics tool to show or hide the statistics table at the bottom of the measurements table. The statistics table provides min, max, mean, and other statistics for the measurement data.
Line Profile Window Display Modes
What is displayed in the Line Profile window depends on the tool selected in the lower left-hand corner. There are three tools available:
The Graph View
Click the Graph View button to display the line profile data as a graph, as shown here:
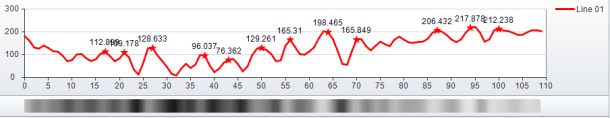
This graph shows the brightness/darkness value (along the Y axis) for each pixel in the line profile (the X axis). If you have calibrated your intensity and/or spatial scales, the calibrated values will be reflected in the graph.
If you are using an Edge Detection tool, the detected edges are identified in the graph by marker along the graph line. For example, in the image above, the triangles and inverted triangles identify the rising and falling edges detected in the image along the line profile.
The graphical display is an excellent way for you to visualize edges in the line profile. For this reason, Image-Pro allows you to insert and delete markers manually using the Profile Window Context Menu. Right-click on the background in the Line Profile window to display the context menu. Click here for more information. The ability to add and remove edges allows you to refine the edge markers after Image-Pro has used its filters and algorithms to automatically identify them.
If you have multiple line profiles drawn in the image, they are all displayed simultaneously, superimposed in the Line Profile window. The currently-selected line will appear more bold than the others. To select a different line, click on it in the graph, or click on it in the image.
Graph View Context Menu
When you right-click in the Line Profile window in the Graph view, the following context menu options appear:
Copy: Copies the currently displayed contents of the Line Profile window window to the Windows clipboard.
Print: Sends the currently displayed contents of the Line Profile window to the printer you specify.
Export Graph: The options in the submenu of this tool are:
Excel: Opens Microsoft Excel, opens a new spreadsheet in the Excel application workspace, and copies the currently displayed
contents of the Line Profile window into it.
Word: Opens Microsoft Word, opens a new document the Word application workspace, and copies the currently displayed
contents of the Line Profile window into it.
Powerpoint: Opens Microsoft Powerpoint, opens a new document the Powerpoint application workspace, and copies the currently displayed
contents of the Line Profile window into it.
Save: Saves the currently displayed
contents of the Line Profile window to the file location you specify. When you click this option, Image-Pro displays
the standard Windows Save As dialog box, prompting you for the file name
and location at which to save the data. In the Save As dialog, select the format you want the data saved in in the Save as Type pull-down list box. You can save the data in a Word, Excel, or Text format.
Append to File: Saves the currently displayed contents of the Line Profile window to a file that already contains data without overwriting the existing data. When you click this option, Image-Pro displays the standard Windows Save As dialog box, prompting you to select the existing file to which you want the data appended. It can be a Word, Excel, or Powerpoint file.
Add Edge: For this option to become available, you must right-click on a portion of a line as it appears in the line profile window. This control allows you to manually place an edge marker in the line profile. For example suppose you want to identify peaks in an image but, even though your filters are ideally defined (that is, using the Match Length, Threshold (%), Hotspot (%), and other filter controls), there are still one or two peaks that are not detected. You can right-click directly on the peak, select Add Edge, and then select the kind of edge you want to add. An edge of the selected type will be placed at the clicked-on location. See also Using the Edge Detection Tools.
Delete Selected Edge: For this option to become available, you must right-click on an edge marker as it appears in the line profile window. This control allows you to manually remove an edge marker from the line profile. For example suppose you want to identify peaks in an image but, even though your filters are ideally defined (that is, using the Match Length, Threshold (%), Hotspot (%), and other filter controls), there are still one or two locations that are mistakenly identified as peaks. You can right-click directly on the undesired marker, and then select Delete Selected Edge from the context menu. The marker will be deleted and all data associated with it will be removed from the line profile data set.
Edge Class: Allows you to assign a classification to the currently selected edges. The available options are those that have been defined through the Class group of the Line Profile ribbon.
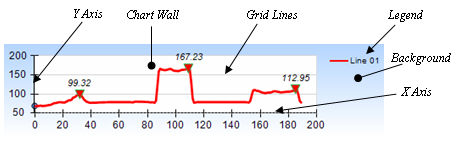
View: The view option has a submenu of additional options you can use to change the appearance of the line profile graph. The various components of the line profile graph are called out in the following graphic.
The options of the View submenu are:
- Axes: Allows you to change the appearance of the title, lines, and ticks for the X and Y axes.
- Legend: Allows you to change the text appearance and location of the line profile legend.
- Grid Lines: Allows you to show horizontal grid lines, vertical grid lines, or both.
- Chart Wall Style: Allows you to change the color, pattern, and other appearance attributes of the chart wall.
- Background Style: Allows you to change the color, pattern, and other appearance attributes of the background.
The Table View
Click the Table View button to display the luminance profile data in a table, as shown
here: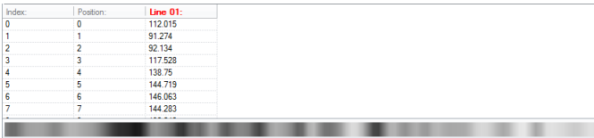
The intensity of every pixel in every line profile drawn in the image is listed in the table.
Table View Context Menu
When you right-click in the Line Profile window in the Table view, the following context menu options are displayed:
Copy: Copies the currently displayed contents of the Line Profile window window to the Windows clipboard.
Print: Sends the currently displayed contents of the Line Profile window to the printer you specify.
Export Table: The options in the submenu of this tool are:
Excel: Opens Microsoft Excel, opens a new spreadsheet in the Excel application workspace, and copies the currently displayed
contents of the Line Profile window into it
Word: Opens Microsoft Word, opens a new document the Word application workspace, and copies the currently displayed
contents of the Line Profile window into it.
Save: Saves the currently displayed
contents of the Line Profile window to the file location you specify. When you click this option, Image-Pro displays
the standard Windows Save As dialog box, prompting you for the file name
and location at which to save the data. In the Save As dialog, select the format you want the data saved in in the Save as Type pull-down list box. You can save the data in a Word, Excel, or Text format.
Append to File: Saves the currently displayed contents of the Line Profile window to a file that already contains data without overwriting the existing data. When you click this option, Image-Pro displays the standard Windows Save As dialog box, prompting you to select the existing file to which you want the data appended. It can be a Word, Excel, or Powerpoint file.
The Measurements View
Click the Measurements View button to display measurement data obtained from the line profile(s) drawn in the image. The measurement data displayed in this view depends on the measurements you have requested through the Measurements group in the Line Profile ribbon.
Click here for information about using the Measurements group controls to obtain measurement data from your line profiles.