Tracking Histogram
The Tracking Histogram displays a distribution graph of the selected measurement type for the results of a motion tracking operation. the data on the Tracking Histogram is always statistical data for each track in the sequence. Each track is composed of many vectors, each of which has measurement data associated with it. The Tracking Histogram does not show measurement data for the vectors, but rather statistical data for collection of vectors associated with each track.
The histogram display is highly interactive. Click on a vertical bar in the Tracking Histogram display and the corresponding track(s) will be highlighted in the image.
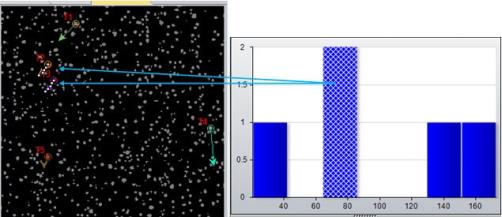
Similarly, you can click on a track in the image, and its place in the vertical bar chart will be highlighted.
The controls of the data histogram are described below.
Measurements: The Measurements pull-down list box, located in the upper left corner of the histogram window, contains a list of all of the measurements that you selected through the Type tool of the Measurements group. Select the measurement type for which you want to see the data in the histogram display.
Statistics: The Statistics pull-down list box, located to the right of the Measurements list box, lists the statistics you can obtain for the selected measurement. The data on the Tracking Histogram is always statistical data for each track in the sequence. Each track is composed a many vectors, each of which has measurement data associated with it. The Tracking Histogram does not show measurement data for the vectors, but rather statistical data for collection of vectors associated with each track.
Bins: The data set grouping is determined by the number of Bins you define. For example, if the range of values for the selected data set is from 0 to 100 and you select "10" in the Bins field, the data will be grouped into 10 bins: Bin #1 contains objects with values falling between 0 and 10, Bin #2 contains objects with values falling between 10 and 20, and so on.
Classify:
Click the Classify tool to enable classification and color-coding of the
tracks in your image. When
you enable this tool, Image-Pro
creates classes for the tracks in your image according to which Bin they
are in for the currently-selected measurement. For
example, the measurement type "Tracking:Distance" is selected
below, and the tracks are organized into eight bins according to their
Mean distances. The
Classify tool has been used to color code the tracks in the image so that
it can be easily determined to which bin they belong. 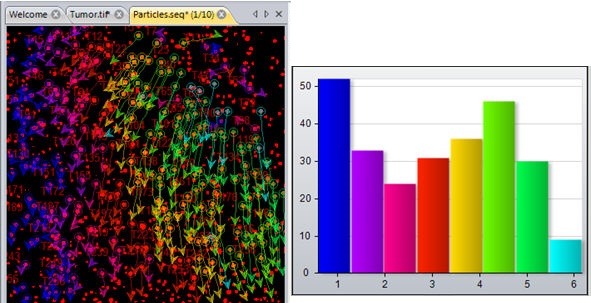
Objects' classification information is written to the "Object:Class"
and "Object:Class Name" measurement types. These
fields are updated every time objects are re-classified using the Classify
tool.
Click the Classify down arrow to show the following menu options:
- Auto Range: This control allows you to limit the range of measurement values to be classified and color-coded. When Auto range is selected, Image-Pro classifies and color codes all bins of measurement data currently displayed in the Data Histogram window -- that is, according to either the full range of measurement values or according to the range specified by the Min and Max spin boxes of the Measurement Filter group. To limit the classification of objects to a certain range of values, uncheck the Auto Range control and enter the desired range in the Start and End spin boxes.
- Use Class Color: Click this checkbox to have colors applied to the classes. The colors are applied according to the currently specified Palette and Spins controls.
Copy: Click this to copy the histogram to the Windows clipboard. The histogram is copied as a bitmap file. It can then be pasted to other applications.
Log X/Y: The Log X and Log Y controls toggles the X and Y axes of the histogram display between expressing the measurement scale in terms of integers and logarithms of integers. The latter provides a 'stretching' effect.