Draw Mode
Texture: Select this option to render the surface plot as a textured version of the image.
Color: Select this option to render the surface plot as a solid structure (as opposed to a wireframe) according to a selected color scheme. There are several color schemes to choose from. Click on the Color tool's down arrow to display the color options:
- Smooth palette: Check this box to have the color modulation (that graphically displays the range of pixel intensities) rendered smoothly. Is unchecked, Image-Pro renders the colors in distinct zones according the number of zones specified in the Zone spin box (described below).
- Contour: Check this box to add contour markers to the 3-D plot, as you would find on a landscape drawing.
- Zones: This spin box controls the granularity of color transitions.
- Palette:
From this list box, select the color palette to use for rending the 3-D
display. Note
that the color scheme selected here will also be used for the wireframe
display (described below).
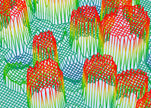
Wire: Select this option to render the surface plot in a wireframe pattern.

If you click on the Wire tool's down arrow, the Resolution picklist is displayed. This control allows you to specify how densely the wireframe should be drawn.
The wireframe option has several advantages. If you set the resolution low, it tends to speed up the surface plot display because it does not draw every pixel. Also, when the surface plot draw mode is "Wire," the plot is drawn on a colorized scale that graphically depicts the range of pixel intensities. Image-Pro provides a legend that describes the scale to which the color modulation corresponds.
Note: The color scheme for the wireframe display is set through the Color tool (described above).