Measurement Options
The Measurement Options panel is displayed when you click on the Options tool on either the Measureor the Count/Size ribbons.
The Panel is divided in two tabs, the first contains Segmentation options, the second contains Appearance options.
Segmentation Tab
Segmentation Options
Connectivity: Defines the pixel connectivity to use for segmentation -- that is, the number of pixel neighbors segmenting the objects.
Clean Borders: Use this control to specify which borders, if any, are out of bounds for the purposes of counting objects. Objects touching the selected borders will not be counted. Setting Clean Borders to All ensures that you only analyse whole objects, and that the mean values for measurements such as Area are accurate.
Fill Holes: Defines if the holes inside objects should be included into the object area measurements. Check this checkbox to tell to fill holes i.e., ignore holes for the sake of area measurements.
Smoothing: Defines the degree of smoothing to be applied to object outlines. Enter a number between 0 and 100, where 100 applies the maximum amount of smoothing and 0 indicates no smoothing.
Bias : This control is only meaningful when you use the Auto Bright or Auto Dark segmentation method to have Image-Pro automatically calculate a threshold to use for segmentation. The Bias control allows you to have Image-Pro automatically adjust the Auto Bright/Dark threshold by a given amount. You must specify both a bias method (RangeMax, Best Fit Range, or Standard Deviation), and a value indicating the degree to which you want the threshold adjusted according to that bias method. There are 3 bias methods:
- Range Max(%M) – The bias is calculated as a percentage of the full range of possible intensities of the image. For example, the max range for 8-bit images is 0 to 255. If the Bias value was specified as 10, then the threshold would be adjusted by 10% of 256.
- Best Fit Range(%B) – The bias is calculated as a percentage of best-fit range for the image. For example, if the best-fit range for a given image is 25 to 200, then the bias would be calculated as a percentage of 175 (or 200 minus 25). If the Bias was specified as 10, then the threshold would be adjusted by 10% of 175.
- Standard Deviation(SD) – The bias is calculated by multiplying the bias value and the standard deviation of the image intensity distribution. For example, if the standard deviation of image intensities was 56.51, and the Bias value was specified as .10, then the threshold would be adjusted by .10 * 56.51
Hint: Use the Bias control in combination with the Mean, Mode, Median, Minimum, Maximum, Best Fit Min, or Best Fit Max option of the Auto-Threshold control. These Auto-Threshold options allow you to have Image-Pro set the segmentation threshold at or relative to an upper or lower limit to the intensity distribution range; the Bias control can then be used to adjust the threshold in a consistent way relative to the unique distribution of intensities in each image. These methods can be used with batch macros to count and measure objects with intensities above or below a threshold by fixed value.
Auto-Threshold: This control is only meaningful when you use the Auto Bright or Auto Dark segmentation method to have Image-Pro automatically calculate a threshold to use for segmentation. The Auto-Threshold controls how that threshold is calculated. Use the following options to have the threshold calculated in a way that tries to distinguish objects of interest from noise.
- Min Variance - The ratio of between-phase to total variances minimized (method of Otsu). This is the default method.
- Legacy method. A version of Minimum Variance method with a bias towards low values.
Use one of the following options in combination with the Bias control. These options set the threshold at various limits or median positions relative to these limits. Refer to the Bias control description for more information about how they can be used with the Bias control.
- Mean - Threshold is the Mean value of histogram.
- Mode - Threshold is the Mode value of histogram.
- Median - Threshold is the Median value of histogram.
- Minimum - Threshold is the Minimum value of histogram.
- Maximum - Threshold is the Maximum value of histogram.
- Best Fit Min - Threshold is the Minimum of best-fit range of histogram.
- Best Fit Max -Threshold is the Maximum of best-fit range of histogram.
Grow: Use this option to have Image-Pro erode or dilate (shrink or grow) segmented objects prior to applying the count size measurements. Enter a positive number to ‘grow’ the segmented objects by the specified value, in pixels. Enter a negative number to ‘shrink’ the segmented objects by the specified value, in pixels.
Use Restricted Grow - Prevent object merging at grow operations. The option affects grow at Count, when the Grow option is more than zero.
Ring Only - Create a ring between original and expanded/shrunk object outlines.
Ring Offset - Ring offset from the original object outline, in pixels. If offset is negative, the ring is extended in the direction opposite to grow. Note that the ring width is the difference between Grow and Offset.
Count Options
Objects: When you do a Count/Size operation, you can have Image-Pro find the whole objects, or you can have it find other object selections, such as their Convex Hulls, Holes, and so on. Click on the Objects pull-down list box to reveal your options:
- Convex Hull – creates object convex hulls.
- Ellipse - adds equivalent ellipses
- Holes - shows only holes of regions
- Longest line – creates longest lines of each object
- Major axis average - line as average positions of centers along major axis
- Extreme boundary average – line as extreme boundary average along major axis
- Point center - create points in the centers of thresholded objects
- Point top-left - create points in the top left corner of objects
- Vectorize - vectorizes objects creating skeleton lines and optional nodes and endpoints.
The Vectorize operation has several options that define the created object types and the way they are created (Prune, Link).Hover over Vectorize to access the options:
Vectorize Options:
Object types (created in separate classes):
- Skeleton - extract skeleton vectors as lines(default).
- End Points - extract end points.
- Nodes - extract 3+ connection nodes as points.
- Single Points - extract single pixel points.
- Branches - extract branches (open vectors) in a separate class. When this option is on, the Skeleton class includes only closed segments (segments that don't end on anendpoint).
- Link–the size of the gaps to link, in pixels. This option is used to close small gaps in the skeleton.
- Prune–the number of pruning iterations. The option is used to cut short branches from the skeleton tree.
Preserve existing data: This option allows you to accumulate multiple Count/Size operations for the same image and establish parent-child relationships between objects. When this option is active, existing object outlines will be retained when new counts are executed. The newly segmented objects will be added to new class(es) with higher indices. The existing objects of the first class will be assigned as Parents of newly segmented objects located inside them. Objects segmented outside the existing outlines will not have parents. By default, Reset existing data is on, so old data is deleted when a new Count operation is executed.
Use As Outlines: When this option is active, the segmentation is done only within existing object outlines (equivalent of using object outlines as ROIs).
Close Threshold Tool After Count: Select this option to automatically close the Threshold Tool after executing a count.
Appearance Tab
The Appearance tab provides many options for configuring the appearance of measurement overlays and text in the image.
Text Options
The Font group provides standard font style and color options for adjusting the appearance of measurement text.
You can choose a font from the drop-down list.
You will see the measurement labels change to the font you select. Use the color, style, and size buttons to make additional changes to the measurement labels.
Shadow (S) lets you add a background shadow color to the label text.
Bold (B) displays the font in bold.
Italic (I) displays the italic font.
Underline (U) underlines the label text.
Class Coloruses the class color for the label.
Color (‘A’) lets you select the text color.
Labels: The Labels group provides display options for the content, positioning, and appearance of measurement labels.
- Text: Defines the text to be displayed with measurements. You can select "None" (no labels will be shown), "Measurement" (measurement data will be shown), "Name" (the measurement name will be shown), or "Name and Measurement."
- Position: Defines the position for label text relative to the bounding box of the measurement feature.
- Decimals: Defines the number of digits after the decimal point to be displayed for measured values in data tables and measurement labels.
- Units: Check/uncheck this box to show/hide measurement units in the label text. (Only applicable if "Measurement" or "Name and Measurement" is selected for Text.)
- Abbreviation: Check/uncheck this box to show/hide measurement names in the label text (only applicable if "Measurement" or "Name and Measurement" is selected for Text.)
- Label Measurements.: Defines the type of measurement data to be shown if "Measurement" or "Name and Measurement" is selected for Text. Through this control, you can set the type of measurement data to be shown for each category of measurement feature: regions, lines, points, angles, best-fit line, best-fit circles, and best-fit arcs.
Color and Shape Options
Class: Select the Class for which you wish to set Color and Shape Options.
Coloring: Choose between the Class and Random radio buttons to assign colors to your class objects.
You can change the color assigned to a class from the color picker.
Filled: Select this check box to display class objects filled, leave it unchecked to only display the outlines of class objects. With filled selected you can set the opacity of the fill to values from 0 to 100% in 10% increments from the drop-down menu.
Border: Select this check box to display the border of objects at 100% opacity and with the Shape Options applied.
Line Style: Choose from a selection of dashed, dotted, and solid line styles.
Point Shape: Select the style to be applied to points.
End Points: Choose from a selection of line end point options, including arrows, dots, and crossbars in various sizes.
Line Width: Set the width lines in pixels.
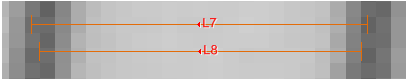
Pixel aligned: Check this box if you want Image-Pro to automatically snap the end-points of measurement features to the center of pixels. The option affects only manually drawn features. For example, in the example below, "L7" is pixel aligned; "L8" is not:
Outline Pixels: with this option selected object outlines are drawn around boundary pixel tiles. When the option is off, the outline goes through the boundary pixel centers. This option only affects the next segmentation results and it will affect polygon-based measurements, making many of them similar to pixel-based measurements.
Sync Classes: Click on this button to apply the currently displayed Color and Shape Options to all classes.
Cursor Options
The Cursor Options group provides options that control the appearance and functionality of the cursor when you are drawing measurements in your images.
Cross Bars: Select/deselect this option to turn on/off the bars that appear at the end points of lines, perpendicular to the lines as you draw them in the image. The Cross Bars can be used to set measurements perpendicular to image objects, for example.
Crosshair: Select this option to show a crosshair of the cursor position whenever a measurement tool is selected.
Tooltip: This option shows/hides measurement tooltips.