Edges
The Edges group of the Line Profile ribbon provides tools you can use to find peaks, valleys, and patterns in the line profiles drawn in your images. The Edge detection tools are described below:
Peaks: Use this tool to find peaks on the profile.
Valleys: Use this tool to find valleys on the profile.
Rising Edge: Use this tool to detect rising edges in the profile
Falling Edges: Use this tool to detect falling edges in the profile.
Pattern A/Pattern B: Use these tools to detect user-defined patterns in the profile. To define the pattern, click on the arrow to the right of the tool to display the Edge Settings dialog (described For the Pattern A and Pattern B Tools).
Weighted Profiles:
This checkbox allows you to display and hide the Weighted Profiles (WPs)
and Threshold Lines (TLs) that correspond to the active line profile.
A Weighted
Profile is a graphical representation of the active line profile as it
is interpreted by Image-Pro
for the purposes of edge detection. Whether
or not an edge is detected at any given point on a line profile depends
on the Edge Settings that are
defined for that line, for example, the Threshold, Max Edges, and Min
Edges values. The
weighted profile is the representation of the line profile after all options
have been applied.
In the example below, suppose the red line is the active line profile of
a line drawn in the image. Also
suppose that the Rising Edge detection tool has been selected, and, given
the current Threshold setting of "50," five edges have been
detected -- all of the prominent edges in the profile except for the far
right one. 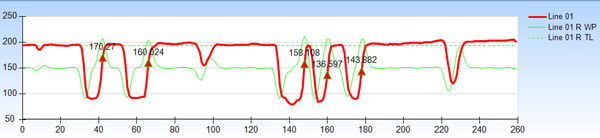
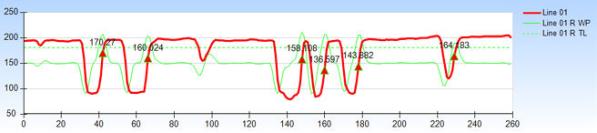
Why Image-Pro detected all of the prominent edges in the profile except for the far right one can be explained by looking at the dashed green line (the threshold line) and the solid green line (the weighted profile). Notice that the threshold line intersects all peaks of the weighted profile except for the far right one. To have the far right edge detected, the threshold line would have to be lowered enough to intersect the far right peak of the weighted profile. This could be accomplished in many ways by changing various Rising Edge tool settings. One way would be to set the Threshold value lower; for example, change it from "50" to "30." The result of lowering the Threshold value is shown in the following picture. Notice that the far right edge is now detected.
Lock Settings: Select this option to tell Image-Pro to apply the Edge settings and definitions you define through the Edge group to all line profiles in the image. For example, if you have the Lock Settings tool enabled and you then enable the Valleys tool, then Image-Pro will find and mark the valleys in all active line profiles in the image.
Edge Settings
Use the pull-down arrow next to any of the tools to open the Edge Settings dialog for that tool.
Options available to all the edge detection tool are described below.
- Label: Use the text box to enter a letter or word to identify the markers. Use the color picker tool, to the right of the Label text box, to apply a color to the label text.
- Show Ticks/Show Labels: Uncheck these boxes to hide the ticks and labels that appear in the edge detection overlay. For example, to hide the Peak detection ticks and labels, click on the arrow next to the Peak button, and uncheck the Show Ticks and Show Labels check boxes.
- Length: The value you enter for Length defines the length of the ticks on the line profile.
- Angle: The value you enter for Angle defines the angle of the ticks relative to the line profile, in degrees.
For the Peak, Valley, Rising, and Falling Tools
- Edge Finding Method: Select "Correlation" to find peaks based on uncorrected background values. Select "Weighted" to find peaks based on background-corrected values.
- Smoothing: Increase this value to smooth out the line profile thereby reducing the number of peaks.
- Offset: In this spin box, you can specify an offset (in +/- pixels) that you want the edge marks placed relative to the calculated locations.
- Threshold (%): The Threshold (%) defines the minimum difference between an extreme point and neighboring opposite extremes. If the difference between the extremes is smaller than the sensitivity threshold, the marker is ignored. The Threshold (%) is defined in percentage from 0 to 100 from the dynamic range of thelineprofile. The lower the threshold, the more peaks/valleys will be identified. For example, a value of one makes it so that many peaks and valleys are detected, even when deviations of intensities are very small.
- Hotspot (%): Identifies the point (pixel location) along the specified Match Length segment at which the marker will be placed, expressed as a percentage of the match length. For example, if the Match Length is 9 and the Hotspot is set to 33%, markers will be placed at the third pixel of matching segments.
- Min Edges: At least this many edges will be marked, up to the number of edges that match the search criteria (i.e., as defined by the Threshold (%) control).
- Max Edges: No more than this many edges will be marked, even if more edges have been identified as matching the search criteria (i.e., as defined by the Threshold (%) control). If more edges are identified than the number specified here, Image-Pro selects the best-matching edges to be marked.
For the Pattern A and Pattern B Tools
The Edge Settings dialog for the Pattern A and Pattern B tools allows you to the define the pattern and then set various thresholds to optimally configure the detection algorithm to find the pattern.
To define the pattern, click on the pattern graph and then draw a line in the image over a sequence of pixels that best model the pattern.
- Match Length: This number represents the minimum length of a segment in which a pattern might be found. For example, pixel combinations matching the pattern but larger than this length will not be identified as a match.
- Hotspot (%): Identifies the point (pixel location) along the specified Match Length segment at which the marker will be placed, expressed as a percentage of the match length. For example, if the Match Length is 9 and the Hotspot is set to 33%, markers will be placed at the third pixel of matching segments.
- Threshold (%): The Threshold (%) defines the minimum difference between an extreme point and neighboring opposite extremes. If the difference between the extremes is smaller than the sensitivity threshold, the marker is ignored. The Threshold (%) is defined in percentage from 0 to 100 from the dynamic range of thelineprofile. The lower the threshold, the more peaks/valleys will be identified. For example, a value of one makes it so that many peaks and valleys are detected, even when deviations of intensities are very small.
- Size wtg (%): This control is only meaningful if the Match Size checkbox is checked. This control determines the threshold for whether or not a candidate for a match is determined to be the same size as the reference pattern. The lower the number, wider is the range of deviation from the size of the reference pattern. The higher the number, the more strictly the size has to be the same as the reference pattern.
- Min Edges: At least this many pattern matches will be marked, up to the number of patterns that match the search criteria (i.e., as defined by the Threshold (%) control).
- Max Edges: No more than this many pattern matches will be marked, even if more patterns have been identified as matching the search criteria (i.e., as defined by the Threshold (%) control). If more patterns are identified than the number specified here, Image-Pro selects the best-matching patterns to be marked.
- Match Offset: When this box is checked, Image-Pro finds only those patterns that are close to the mean luminance of the reference pattern. For example, you might use this option if you were looking for a “W” shaped pattern on top of bright sections of the profile, but you wanted to exclude such profile patterns where the image was dark.
- Match Size: When this box is checked,
Image-Pro
finds only those patterns that match in amplitude as well as shape, where
amplitude is defined as the difference between the lowest and highest
pixel values in the pattern segment. For
example, you might use this option if you were looking for medium sized
luminance peaks, but you wanted to exclude very bright spots.
When this box is checked, the Size wtg (%) value determines the threshold for matching the size criteria. See the description of the Size wtg (%) control for more information.