Histograms
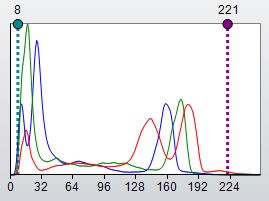
Histograms measure and illustrate, in graph form, the brightness and contrast characteristics of an image. To create a histogram, the number of pixels at each intensity value (e.g., 0-255 for 8-bit images) are counted and charted. In the example below, you can see the X-axis describes the intensity value (0-255), and the Y-axis graphs the number of pixels in the image that contain that value (the frequency of that intensity).

A histogram will show you what kind of brightness/contrast deficiencies exist in an image. Images with low contrast will have histograms that are clustered around a very narrow portion of the color range. The position of the cluster will indicate whether the image is too dark, too light, or simply too gray, as shown in the three examples below.

See also: