Free Form Intensity Calibrations
Another way to make LUT (lookup table) adjustments to an image in Image-Pro is by creating an intensity scale calibration definition. This method allows you to define how each intensity value encountered in an image is to be rendered for viewing. By default, no intensity calibration is applied to images -- therefore, if a pixel has an intensity value of 35, it is rendered with an intensity value of 35. However, you can calibrate the image so that pixels with intensity values of 35 are rendered as if they had some other value.
Note: It is important to point out that intensity calibrations are applied after all other LUT modifications, not before. Thus the calibration will be further adjusting already-adjusted values if BGC, BL, or WL settings are in effect.
There are two ways to define an intensity calibration in Image-Pro.
- The calibration values are calculated from a number of user-defined
reference points that are fit to a curve.
--or-- - The calibration is not calculated, but it is defined by a user-defined LUT that specifies, for each value on the intensity scale, the corresponding value that should be output.
Creating an Intensity Calibration -- The Calibration Curve Method
With this method, you create an intensity calibration by defining a curve that calibrates all possible intensity values in the image. The curve describes how the intensity values within the image will be interpreted by Image-Pro. The horizontal axis depicts the incoming intensity value, and the vertical axis, the output value produced by calibration.
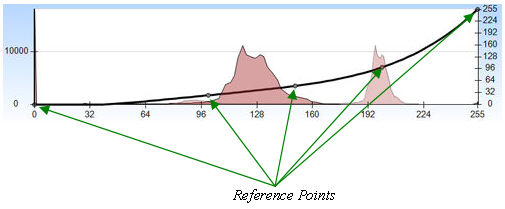
A curve is created by "fitting" a line to two or more reference points. In the example above, five reference points have been defined:
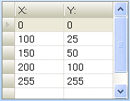
The X value of each reference point indicates the intensity value to be calibrated, and the Y value of each reference point indicates the resulting value. The reference points in the example above suggest a non-linear curve. At the lower end of the scale -- at the second reference point -- intensity values are only given 1/4th of their actual value (that is, a pixel with an intensity value of 100 will be rendered with an intensity value of 25); at the upper end of the scale -- at the third reference point -- intensity values are given 1/2 of their actual value (a pixel with an intensity value of 200 will be rendered with an intensity value of 100).
In the example above, a line has been 'fitted' to these reference points using polynomial interpolation, and the result is a non-linear curve.
To create an intensity calibration curve:
- Create reference points, as needed.
Remember, the X value of the reference point indicates the intensity value to be calibrated, and the Y value of the reference point indicate the value to which the X value should be calibrated. Click here for step-by-step instructions. -
Select a 'fitting' method to fit a curve to the reference points.
To do this:
-
Click on the down arrow below the Free Form tool on the Advanced Display ribbon.
-
Click on the desired fitting method.
- Image-Pro "fits" the curve to the specified points according to your selection.
-
Creating an Intensity Calibration -- The Lookup Table Method
With this method, you create a lookup table of resulting values for every possible intensity value in the image. The lookup table is defined through the "X,Y" table in the Table View of the Advanced Display window.
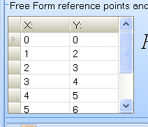
The X value of each row indicates the intensity value to be calibrated, and the Y value of each row indicates the resulting value. The lookup table is created by providing an X,Y pair for every possible intensity value in the image.