The Data Histogram displays a distribution graph of the selected measurement type. For example, in the following data histogram, the Region:Area measurement type is selected. The graph shows a distribution of Area measurements organized into 14 bins. It shows that there are ten objects with areas between 0 and 120 units, four objects with areas between 121 and 240 units, and so on.
The histogram display is highly interactive:
- Click on a vertical bar in the Data Histogram
display and the corresponding object(s) will be highlighted in the image.
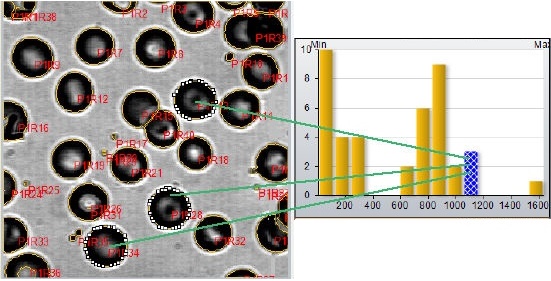
Similarly, you can click on an object in the image, and its place in the vertical bar chart will be highlighted. - Set a filter range based on objects selected in the image. Simply click in the image on objects representing the minimums and maximums of the desired filter range, and then click on the Set Selection button in the Data Histogram dialog. The selection of objects in the image is updated accordingly.
- Set a filter range based on min and max values entered into the Data Histogram dialog. Simply enter the desired filter range in the Min and Max spin boxes of the Data Histogram dialog and click the Apply Filter button. The selection of objects in the image is updated accordingly.
-
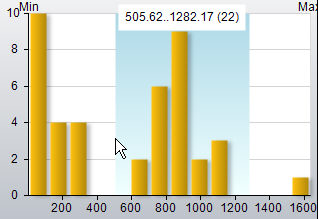
Set a filter range by selecting the desired vertical bars in the histogram. To do this, click and drag the mouse to select the desired range in the histogram display:
Click the Set Selection button:
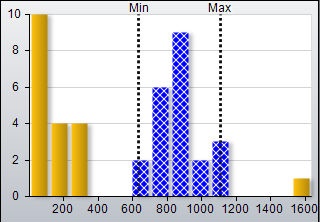
And then click the Apply Filter button. The selection of objects in the image is updated accordingly.
------------------------------------------------------------------
Data Histogram
The controls of the data histogram are described below.
Measurements: The pull-down
list box at the top-left of the histogram window contains a list of all of the measurements that you selected
through the Type tool of the Measurements
group. Select
the measurement type for which you want to see the data in the histogram
display.
This
pull-down list box next to the measurements lists the statistics you can obtain for the selected
measurement. It
is only available (and meaningful) on the Tracking Histogram. The
data on the Tracking Histogram is always statistical data for each track
in the sequence.
Bins: The data set grouping is determined by the number of Bins you define. For example, if the range of values for the selected data set is from 0 to 100 and you select "10" in the Bins field, the data will be grouped into 10 bins: Bin #1 contains objects with values falling between 0 and 10, Bin #2 contains objects with values falling between 10 and 20, and so on.
Classify: Click the Classify tool to enable classification and color-coding of the measured objects in your image. When you enable this tool, Image-Pro creates classes for the objects in your image according to which Bin they are in for the currently-selected measurement.
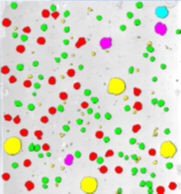
The following image shows many objects organized into five bins according to their Area, and the Classify tool has been used to color code objects so that it can be easily determined to which bin they belong.
Objects' classification information is written to the "Object:Class" and "Object:Class Name" measurement types. These fields are updated every time objects are re-classified using the Classify tool.
Click the Classify down arrow to show the settings menu:
-
Auto Range: This control allows you to limit the range of measurement values to be classified and color-coded. When Auto range is selected, Image-Pro classifies and color codes all bins of measurement data currently displayed in the Data Histogram window -- that is, according to either the full range of measurement values or according to the range specified by the Min and Max spin boxes of the Measurement Filter group.
To limit the classification of objects to a certain range of values, uncheck the Auto Range control and enter the desired range in the Start and End spin boxes.
- Use Class Color: Click this checkbox to have colors applied to the classes. The colors are applied according to the currently specified Palette and Spins controls.
Copy: Click the Copy tool to copy the histogram to the Windows clipboard. The histogram is copied as a bitmap file. It can then be pasted to other applications.
Log X/Log Y: The Log X and Log Y controls toggles the X and Y axes of the histogram display between expressing the measurement scale in terms of integers and logarithms of integers. The latter provides a 'stretching' effect.
Measurement Filter
The following controls are in the Measurement Filter area of the Data Histogram.
Active: Enables/disables the filter feature of the Data Histogram dialog box. This checkbox must be selected to apply filters to the Count/Size data set.
Reset: Resets the Min and Max fields to their default values.
Min/Max: These spin boxes allow you to filter objects found in the image based on a specified range of values. Only objects with values that fall between the Min and Max values will be included in the count. Note that after a Min or Max value is defined, it will only be applied to the image when you click the Apply Filter button (described below).
Set Selection:
Sets the data range of the selected objects in the image as the filter
range. When
you click this button, the Min and Max spin boxes are adjusted according
to the minimum and maximum values of the currently selected objects in
the image. Click
the down arrow of the Set Selection tool to show the following options:
- Exclude Selection Max: Click this option to set the filter range to all values below the lowest value of the currently selected set of objects.
- Exclude Selection Min: Click this option to set the filter range to all values above the highest value of the currently selected set of objects.
- Inflate (%): The filter range applied by the Set Selection tool will be padded on the upper and lower ends by the percentage value specified in this spin box.
Apply Filter: Applies the filter defined by the Min and Max spin boxes (described above) to the image. Only objects with values that fall between the Min and Max values will be included in the count.