Creating a Chart-Based Report
These instructions describe the steps used to add a chart to your report templates. They assume you have a report you are working on in the Scripting Workbench application (on the Scripting ribbon bar, click on Scripting Workbench in the Macros group).
-
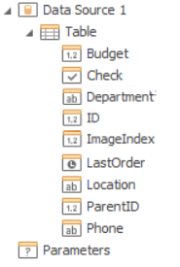
Using the Data Explorer panel in the Scripting Workbench application workarea, bind your template to the table that has the data you want to visualize in a chart. For example, the active template in the Scripting Workbench is bound to a table called "table" in "Data Source 1" in the example below.
-
In the report template you are working on, place your cursor where you want to insert the chart, and then click the Chart command of the Toolbox group. This is located on the Insert tab of the Report Tools group of ribbons.
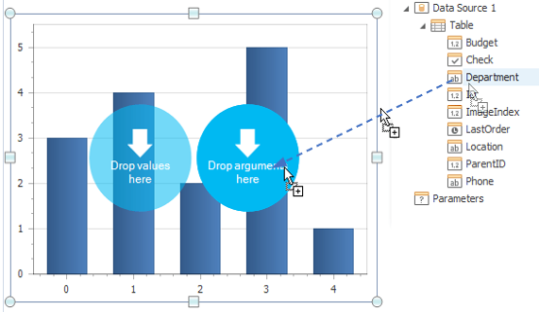
A blank chart appears in the template withblue circles corresponding to the values and arguments of the chart.
-
Drop one field from the Data Explorer onto the "arguments" region in the chart and the other onto the "values" region.
... -
You can change the default chart type to one that best meets your requirements by selecting the chart and switching to the Design tab of the Scripting Workbench toolbar. For example, there are options for making it a Pie chart or a Bar chart.
In the same tab, you can also run Chart Wizard and select the chart's palette and visual appearance. -
The report with a chart is now ready. To view the result, switch to the File menu of the Scripting Workbench toolbar and click the Print Preview button.
Learn more about all features in The Review Tab